|
Average vs Annualized Gains a continuation of Part I |
Once upon a time, while roaming Morningstar, I larned something neat:
We suppose that the annual gains for a sequence of years are: R1, R2, R3, etc. (where, for a gain of 12.3% we'd put R = 0.123).
A buy-and-hold investment will then grow by a factor G1 = 1 + R1 in the first year, then by a factor G2 = 1 + R2 in the second year etc. ... and eventually by a factor GN = 1 + RN (during the last of N years).
The growth over all N years is just G1G2G3...GN and if our Annualized Gain Factor is called simply G, then
|
(1) GN = G1G2G3...GN |
>A "buy-and-hold" investment? Why do you ...?
The annualized gain isn't that easy to calculate if you're putting money in and/or taking money
out, like Dollar Cost Averaging, for example. So, to make things simpler, we'll
just invest $1.00 and leave it there - and watch it grow for N years. Otherwise, you'd have to
take a look at the Rate of Return stuff ...
>Please continue.
Okay. The Average (or Mean) Gain Factor is just:
|
(2) A = { G1+G2+G3+...+GN }/N = (1/N)Σ Gn = (1/N)Σ (1+Rn) = 1 + (1/N)ΣRn |
For convenience (later!), we'll put:
(2A)
Gn = 1+Rn = A(1+rn)
so
rn = Gn/A-1 measures the deviation of the Annual Gain Factors
from their Mean. That'll change Equation (1) into:
(1A) GN = AN (1+r1)(1+r2)...(1+rN)
Further, the Standard Deviation is given by {the Mean-of-the-Squares} - {the Square-of-the-Mean}:
|
(3) SD2 = (1/N){ G12+G22+G32+ ...+GN2} - A2 = (1/N)ΣGn2 - A2 = A2{ (1/N)Σ(1+rn)2 - 1 } |
Our objective is to see which of G and A is larger and ...
>But you already said that A is larger than G, in Part I.
Yes, but now I'd like to estimate how much larger ... with a wee bit o' math.
|
>Wake me when you're done. (4) N log(G) = N log(A) + Σlog(1+rn) Now we use a magic formula, namely: (5) log(1+x) = x - x2/2 + x3/3 - + ... which, as you can see, is pretty good when x is small >That's assuming you're using natural logs, to the base e, so why don't you say LN instead of .... | 
|
(6) N log(G) = N log(A) + Σ { rn - rn2/2 + rn3/3 - + } = N log(A) + Σ rn - (1/2) Σ rn2 + error1
Now we recognize some of the stuff here. In fact, from Equation (2):
- A = (1/N)Σ Gn
= A(1/N)Σ (1+rn)
= A + A(1/N)Σ rn
'cause Σ1=1+1+1+... = N
Hence: Σ rn = 0
- SD2 = A2{
(1/N)Σ(1+rn)2 - 1
}
= A2{
(1/N)Σ(1+2rn+rn2)
- 1}
= A2{
1 + (2/N)Σrn
+ (1/N)Σrn2
- 1}
Hence SD2 = A2(1/N)Σrn2 'cause Σ 1 = N and we already know that Σrn = 0.
So we get Σrn2 = N SD2/A2
>zzzZZZ
We can now substitute for Σrn
and Σrn2 in Equation (6),
and get (after some fiddling):
(7) log({G/A}2) = - SD2/A2 + (2/N) error1
Now we use the magic formula (5) again, in the form:
log(z) = (z-1) - (z-1)2/2 + - ... = (z-1) - error2 with z = {G/A}2
which gives (finally!):
{G/A}2 - 1 = - SD2/A2 + (2/N) error1 + error2
|
>zzzZZZ Since we have an exact result, from Equation (3), namely: SD2 + A2 = (1/N)ΣGn2and the approximate result, above, namely: G2 + SD2 = A2 we get a neat approximate picture of the geometric relationship between the Geometric Mean G and the Arithmetic Mean A and the Standard Deviation SD and ... |  |
>Finally! A picture!
Here's another, using the approximation generated above:

>Yeah, but just how good is the approximation?
Good question. Here's a collection of annual returns, over ten years. For each we calculate the Exact annualized return and the Approximation and note the Error = Exact - Approximation:

>I've seen the approximation: Average = Annualized + SD2/2
Well, let's see. Our formula, above, is: >Both are approximations, right?
Right, but I like mine better. >You win!
Well ... thank you.
(1+Average)2 = (1+Annualized)2 + SD2
and, if the returns are small, we'd get:
1+2(Average) = 1+2(Annualized) + SD2
'cause (1+x)2 is approximately 1+2x
and that'd give
Average = Annualized + SD2/2
Suppose, for example, we have two returns: +50% and -50%. Then we'd have:
Actual Average = {(50%)+(-50%)}/2
= 0.00%
SD2 =
{(50-0)2+(-50-0)2}/2 so SD = 50%
Annualized =
{(1+0.5)*(1-0.5)}1/2 - 1 = -0.134 or -13.4%
so we compare:
Approximation#1 = Annualized + SD2/2 = - 0.9%
and
Approximation#2 =
SQRT{(1+Annualized)2 + SD2} - 1
= 0.000 or 0.00% which agrees with the actual Average.
In the meantime, I'll leave you with the Mean Annual Return for the
S&P 500 (Averaged over a time period from some time in the remote past to the present ...
well ... May, 2001) and the actual Annualized Return - again Annualized over the same time period -
and the Approximation#2 (using the Standard Deviation over the same time period):
You can play with the approximation:
(1+Annualized)2 = (1+Average)2 - Standard_Deviation2
|
| 
|
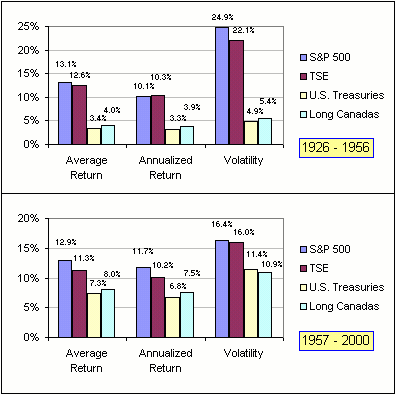
One last thingy: Here's a chart comparing Canadian and US stocks and bonds. Notice that, in 1926-1956, the TSE average return was smaller but the annualized return was higher ... because of the smaller TSE volatility (or standard deviation):


