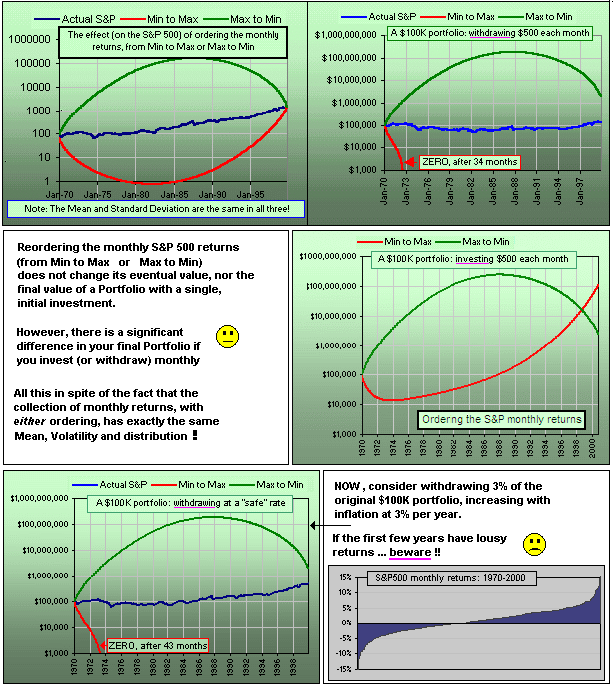
Having accumulated a Portfolio, you retire and start withdrawing. There are a jillion question to ask:
- What percentage should I withdraw each year?
- Is there a Safe Withdrawal Rate? (SWR)
- What is the influence of inflation?
- Shall I use actual historical returns and Monte Carlo or assume some "future" distribution of returns or ...?
- Are there studies on the subject? What are the historical precedents?
- What if I ...
>So?
So an early study was the Trinity Study which examined various portfolio allocations (stock + bonds)
to see which would have survived N years with a particular withdrawal rate.
For example, with a portfolio of 75% stocks + 25% bonds your portfolio would have lasted 30 years (with a 98% probability) had you withdrawn 5% each year.
>What stocks? What bonds? What period of time?
Good questions. I think the stock component was the S&P500 and for bonds, high grade corporate bonds were used ... and it covered the period 1926 to 1995.
However, that's not so important since there have been a jillion such studies since Trinity. See the table?
The usual assumption is that you withdraw x% of your initial portfolio, then increase that each year according to the Consumer Price Index. That means that, once you've started withdrawing, your withdrawals are predetermined for the next umpteen years.
They ignore current market machinations.
It ignores the fact that your portfolio has grown from $500K to $10M. You withdraw the prescribed amount, based upon that initial $500K.
It ignores the fact that your portfolio has collapsed from $500K to $100K. You withdraw the prescribed amount, based upon that $500K.
>Huh? If my portfolio collapsed I wouldn't keep withdrawing ...
Yes ... so there have been a jillion subsequent studies on SWRs.
|
Allocation | 3% | 4% | 5% | 6% | 7% | 8% | 9% | 10% | 11% | 12% |
100% Stocks |
15 Years | 100 | 100 | 98 | 98 | 93 | 91 | 88 | 77 | 63 | 55
20 Years | 100 | 98 | 96 | 94 | 92 | 84 | 73 | 61 | 47 | 43
25 Years | 100 | 98 | 96 | 91 | 87 | 78 | 70 | 50 | 43 | 35
30 Years | 100 | 98 | 95 | 90 | 85 | 78 | 68 | 54 | 49 | 34
75% Stocks + 25% Bonds |
15 Years | 100 | 100 | 100 | 100 | 96 | 95 | 91 | 79 | 63 | 46
20 Years | 100 | 100 | 100 | 96 | 94 | 88 | 71 | 51 | 41 | 33
25 Years | 100 | 100 | 98 | 96 | 91 | 78 | 57 | 46 | 33 | 26
30 Years | 100 | 100 | 98 | 95 | 88 | 73 | 54 | 46 | 37 | 24
50% Stocks + 50% Bonds |
15 Years | 100 | 100 | 100 | 100 | 100 | 98 | 91 | 71 | 50 | 36
20 Years | 100 | 100 | 100 | 100 | 96 | 88 | 61 | 41 | 25 | 10
25 Years | 100 | 100 | 100 | 98 | 96 | 70 | 43 | 22 | 7 | 0
30 Years | 100 | 100 | 100 | 98 | 90 | 51 | 37 | 15 | 0 | 0
25% Stocks + 75% Bonds |
15 Years | 100 | 100 | 100 | 100 | 100 | 100 | 91 | 50 | 21 | 14
20 Years | 100 | 100 | 100 | 100 | 100 | 71 | 24 | 12 | 4 | 2
25 Years | 100 | 100 | 100 | 100 | 78 | 22 | 9 | 0 | 0 | 0
30 Years | 100 | 100 | 100 | 100 | 32 | 5 | 0 | 0 | 0 | 0
100% Bonds |
15 Years | 100 | 100 | 100 | 100 | 100 | 79 | 43 | 38 | 14 | 7
20 Years | 100 | 100 | 100 | 96 | 47 | 35 | 16 | 6 | 0 | 0
25 Years | 100 | 100 | 98 | 52 | 26 | 7 | 2 | 0 | 0 | 0
30 Years | 100 | 100 | 51 | 27 | 0 | 0 | 0 | 0 | 0 | 0
| | | | | | | | | | | | | | | | | | | |
|