| Ito and Options |
Once upon a time we talked about Ito and his magic formula for the distribution of stock prices at some time T in the future:
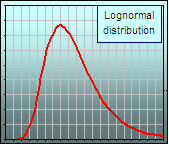
The (lognormal) distribution of Prices P at time T (according to Ito) is:

where Po is the current price and r and s are the annual return and standard deviation respectively. | 
|
In Excel-speak, that'd be:
| f(P) = 1/(s*P*SQRT(2*PI()*T))*EXP(-(1/(2*T*s^2))*(LN(P/Po)-(r-0.5*s^2)*T)^2) |
Now suppose that there was something of financial interest that dependeed upon P, like the price of an Option, TT years from now.
>TT Years? For options?
Sure. For 3 months we put TT = 0.25. Note that TT is the time to expiry, which is not the same as the T in Ito's formula.
Anyway, if we have Ito's P-distribution, then we should be able to generate the distribution of, say, option prices ... T years into the future.
>We can do that? I mean, look into the future?
Why not? If you don't trust this stuff, I'll rent you my magic tool for a small fee.
Okay, let's continue:
If this "other" thing is called C(P) (for example the value of a Call option when the stock price is P), then what's the C-distribution at time T?
>Uh ... I give up.
The P-distribution is such that, of all possible stock prices, a fraction f(P)dP will lie in some small interval of width dP, about the value P.
That means that, of all possible values of C, a fraction f(P)dP will have the value C(P).
That means that the distribution of C-values is proportional to C(P)f(P).
>Huh?
Well, if we add all those C(P)f(P)dP, for all possible prices P, we'd get the Mean (or Expected) value of C(P),
It's like saying:
1% of Cs have the value $1.00 and 3% have the value $1.25 and etc. etc. and 8.2% have the value $3.12 and etc. etc. and 0.08% have the value $8.52.
The mean value would be 1%x$1.00 + 3%x$1.25 + ... + 8.2%x$3.12 + ... + 0.08%x$8.52.
For example, the Expected Stock Price would be the SUM of P f(P) dP.
Let's do an example, using a Call option:
- For the past few years, GE stock has had a mean weekly return of r = 0.042% and a standard deviation of weekly returns of s = 2.9%.
Although we were talking of "annual" data, we can also work with weekly stuff. Just make r and s weekly parameters and measure T in weeks. - The current stock price is $34.87.
- We consider a Call option with a strike price of K = $39.00 and the time to expiry is 30 weeks.
- We also assume a Risk-free Rate of Rf = 0.057% ... that's the weekly equivalent of 3% per annum.
- According to Black-Scholes, the Call premium is $3.05.
>Huh?
Remember Black-Scholes?
We use their magic formula:
| C(P) = P*NORMSDIST((LN(P/K)+(Rf +s^2/2)*TT)/(s*SQRT(TT))) - K*EXP(-Rf *TT)*NORMSDIST((LN(P/K)+(Rf +S^2/2)*TT)/(S*SQRT(TT))-S*SQRT(TT)) |
For P = 34.87, K = 39.00, Rf = 0.00057, s = 0.00029 and, say, T = 5 weeks.
If there's Texp = 30 weeks to expiry, and we're looking T = 5 weeks into the future, then there's TT = Texp - T = 25 weeks left (to expiry). Black-Scholes says: Call premium = C = $4.02. Neat, eh?
>What happened to that mean return ... r = 0.042%?
It's in Ito stuff, but NOT in the Black-Scholes stuff.
Anyway, for each P-value we can calculate Ito's f(P) and Black-Scholes C(P) and generate a bunch of values for C(P)f(P) and that'd give us
the shape of the distribution for the Call premiums: C(P).


The first chart is the shape of the C(P)-distribution and the second chart is the cumulative distribution, giving the percentage of C-values less than $C.
>After T weeks, right?
Right. The red dots indicate the value of C at the time T = 5 weeks (and TT = 25 weeks left, to expiry).
Uh ... what I mean is, that's the value of C if the stock price hadn't changed from $34.87.
>What about the original value of C ... right at the start?
Yup. The spreadsheet will give that, too. It won't change unless you change Texp, the time to expiry.
That value of C is $4.02 and is shown in both charts.
>And there's a 41% probability of being less than $4.02 after T = 5 weeks, right?
Right again .. and that's from the cumulative distribution ... which is far more interesting useful than the density distribution. 
>Where's the spreadsheet?
Uh ... it's coming. 
>And you're sure you know what you're doing?
Uh ... sometimes.
