| John Nash ... a continuation of Part II |
Motivated by the work of
John Nash, we're trying to devise investment strategies that take into account the strategies of other
investors and which assume ...
>Okay, okay. Please continue.
Consider the following scenario:
- There are three types of investors interested in trading in the same stock.
- Investors of type A buy every month ... as a payroll deduction.
- Investors of type B buy when the stock price is above
a Moving Average - "Hey! It's on an UP trend!"
(and they Sell when it drops below the MA). - Investors of type C buy when the stock price falls below
a Moving Average - "Me? I buy low, sell high."
(and they Sell when it rises above the MA). - Any Sell order tends to decrease the stock price.
- Any Buy order tends to increase the stock price.
- All investors start with (for example) $10,000 and have (for example) $50 a month to invest.
- There are Buy / Sell asignments:
When a Buy occurs, those investors are assigned a +1. For a Sell, they are assigned a -1. - Stock prices rise or fall depending upon the weighted average of the three +1 and -1
assignments
(weighted by the percentage of the investor population which is of type A, B or C). - In addition to the stock price changes induced by the Weighted Average of the Buy/Sell assignments, there is a random component (Normally distributed with prescribed Mean and Standard Derviation).
>Huh? Weighted Average of the Buy/Sell assignments?
Consider this:
- Suppose the stock price falls below the MA:
- A investors are always assigned (+1) since they always Buy.
- Since B investors would Sell, they're all assigned a (-1).
- Since C investors would Buy, they're all assigned a (+1).
- If the percentages of each type are 50%,
30% and 20% then this Weighted Average is:
Weighted Average = 0.50 (+1) + 0.30(-1) + .20 (+1) = 0.40
- The stock Return is then given by:
- Return = a (Weighted Average) + b Random(Mean,Standard Deviation)
where Random(Mean,Standard Deviation) is a randomly selected return with prescribed Mean and SD.
- Return = a (Weighted Average) + b Random(Mean,Standard Deviation)
- The influence that each of the "Weighted Average" and "Random component" have upon the stock price is determined by the numbers a and b.
- For example:
- If a = 0.01 and b = 0.50 and Random = 0.05 then the stock price return is:
Return = 0.01(0.40) + 0.50(0.05) = 0.029 or a 2.9% return
where we've generated a Random Return of 5% (that's the 0.05) but included only 50% of it (that's the 0.50), as well as 1% (that's the 0.01) of the Weighted Average.
- If a = 0.01 and b = 0.50 and Random = 0.05 then the stock price return is:
>So?
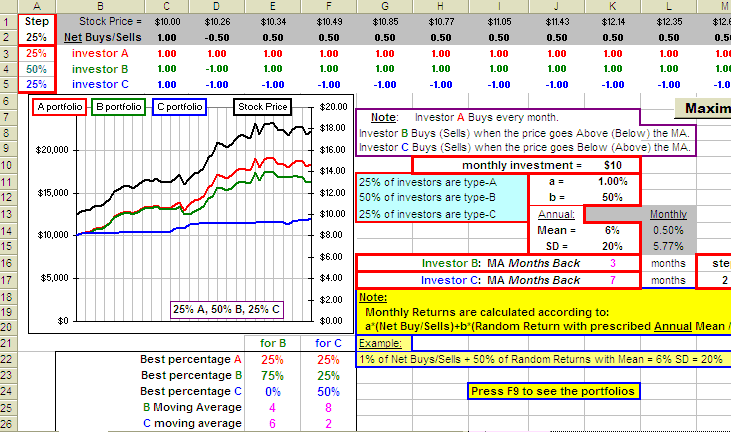
So here's a spreadsheet which plays this game. Here's how you play:
- Pick percentages of each investor type in cells A3 , A4 and A5.
- Pick values for a and b in cells K11 and K12 and Mean, SD in K14, K15.
- Pick Moving Averages for investors B and C in cells K16 and K17.
- Now keep pressing function key F9 to see the portfolios for each investor type.

>What about the monthly investment in cell ... uh ...
Oh, I forgot. You can stick that in cell K10.
>And that Maximum button?
Maximize? Yes. It'll run through a bunch of percentages (with a step size specified in cell A2)
and a bunch of moving averages (with a step size specified in cell M17). You go for a coffee and when you Return
... uh, when you come back, the "best" parameters for each of investors
B and
C are shown at the bottom ...
>Like ... uh, what's best for type C? It's if
25% of investors are type A and there are
0% Cs and ...
And B chooses a 4
month Moving Average.
>If there are no Cs, why does C have a 6 month moving average?
In cell E26? Good question.
It's how the spreadsheet works ... when you click on Maximize.
- A set of percentages and Moving Averages are stuck in the appropriate cells.
- A set of 50 Random Returns are generated to go in row 1
(along with the Weighted Average of Buy/Sell assignments). - The final Portolios for B and C are noted.
- Steps 1, 2 and 3 are repeated and, when we've run through all parameters, the "best" choices are recorded at the bottom.
>So it just happened that those random returns were best for B when ...
Yes. When C had a 6 month MA.
>Seems pretty silly to me.
Then you won't want to play with the spreadsheet.
>How do I play with the spreadsheet?
RIGHT-click on the picture above and Save Target. If you click on Maximize and get
a set of "best" parameters for B or C,
then stick these parameters into the appropriate cells and keep pressing F9 to celect another random set.

