|
P/E Ratios: and their relation to the 10-year Bond Rate see also P/E Ratios |
If we take the current P/E as 25 (roughly the current S&P 500 P/E, as I write this), and assume it varies inversely with the 10-year treasury, we get this historical (and fictitious) chart of earlier P/E ratios:

Compare to the actual historical P/E Ratios:

So, based upon historical Bond Rates, is the market over-priced? 
>You're assuming a current P/E of 25? Why don't you
determine what the P/E should be, today?
Okay, here's what we'll do:
- Plot E/P (data obtained here) vs 10-year T-bond Rate.
- Determine the best fit.
- Use that (based upon data for the last thirty years or so) to determine what the current P/E ratio should be.
 The Best Fit to the E/P vs T-bond data is the straight line: E/P = 0.9402 (T-bond) - 0.0048 Hence, we can get our P/E Ratio estimate from the Magic Formula: P/E = 1/{0.9402 (T-bond) - 0.48%}
Here, we put (T-bond) = 0.052 if the T-bond Rate is 5.2%.
 | 
|

|
>So? >Exactly? >Hey! That's pretty close, isn't it? |
|
>So, this was your idea, right? I mean, to consider historical
long term bond ...
| 
|
>So,
Greenspan
uses historical
E/P ratios to see if the market is overpriced?
Actually, I think, according to Yardeni, he uses 12-month-ahead earnings
instead of our 12-trailing and ...
>So, why didn't you?
Uh ... wait'll I find the data ...
However, one could use the Estimated Earnings found here, but these often win prizes for the best fiction of the year. Just remember:
There once was an Index: S&P
Whose ratios evoked much glee
Pick two numbers at random
Divide them in tandem
And generate your own P-over-E
For example, we could do this
- If Fair Value P/E is 24, and
- Estimated Earnings are $35.47, then
- S&P 500 should be 24 * 35.47 = 851.28 by year's end, so
- a current S&P 500 of 917.93
- makes the current S&P overpriced by 917.93/851.28 - 1 = 0.78 or 7.8%
>I take it that this magic formula is valid back to the beginning of time ...
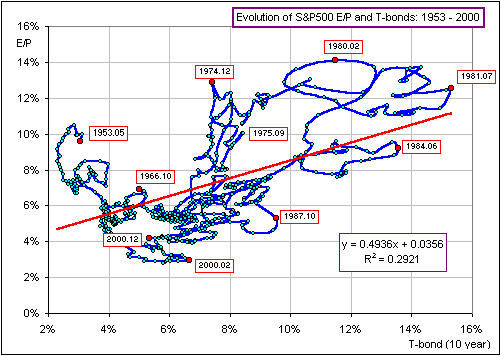
Well, actually ... uh ... it's pretty lousy prior to 1970. For example, from 1953 to 2000 the
E/P vs 10-year T-bond looked like this:

The goodness of the fit ...
>The goodness of the fit? Are we talking shoes or ...?
... is measured by R-squared (see
R-squared bumpf) and you can
see it's pretty lousy for this entire period. But it's interesting, eh? Look at the crash of
1987 where ...
>Am I supposed to be able to follow that
blue line?
Why not?
>Anyway, what does this 1953-2000 goodness of fit predict for the current P/E?
Don't ask.
|
Here, you can play with the magic formula: 1/{0.9402 (T-bond) - 0.0048} based upon 1970-2000 S&P500 data: |
Here, you can play with the magic formula: 1/{0.4936 (T-bond) + 0.0356} based upon 1953-2000 S&P500 data: |
>That's quite a difference! I mean, what good is ...?
If you'd like to see whether looking at the past 10 years will say something about the
next 10 years, take a gander at these charts which show the monthly oscillations of
E/P versus the 10-year T-bonds ... and the "Best Fit" line:

>I don't think I'd like to use the past ten years to predict ...
... the next ten? I'm with you.
>So, how do these formulas compare to the actual P/E?

>Wow! The late 1990s were really out of whack!
Yes, and that has a name.
>Irrational Exuberance?
You got it!

'course, y'all may like to
generate your own P?E ratio(s)
I was surprised to learn that some calculate not E/P values, but use the
Average Earnings over the previous 10 years. Starting in 1970, this would give the following charts, comparing
E/P and E10/P vs T-bonds:
Since the correlation is better (using E10 rather than just E), we get:


|
Using :
1/{0.6492 (T-bond) + 0.0018} based upon 1970-2000 S&P500 data: |
Then again, Shiller uses the "real, CPI-adjusted" S&P500 and Earnings, assuming that CPI = 100 in Jan, 2000. That means that each S&P500 and Earnings value, for month M, is multiplied by CPI(Jan/00)/CPI(M). This gives:
|
Using :
1/{0.8552 (T-bond) + 0.0055} based upon 1970-2000 S&P500 data: | 
|
|
10 years ago, the yield on the 10-year Treasuries was 6%
... and the 30-year average ain't bad 

| 
and with an 80% correlation P/E5 ain't bad either !
Using :
1/{0.8313 (T-bond) - 0.0043} |
