| Fractals & Financial Theory: a continuation of Part I |
>Financial stuff?
Yes.
| Self Similarity |
|
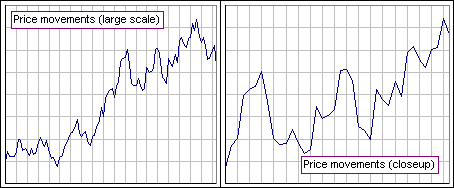
Look at Figure 1. The left chart shows the price of some stock over 100 days.
The right chart shows this same stock, but over some part of that 100-day period. (We've just enlarged a piece of the left chart.) Does Figure 1 suggest something? >Uh ... nope.
>Wait? Self similarity!
|  Figure 1 |
... movements of a stock or currency all look alike when a market chart is enlarged or reduced ...He then goes on to do something similar to what Elliot did, years before.An observer then cannot tell which of the data concern prices that change from week to week, day to day or hour to hour. This quality defines the charts as fractal curves.
>So we're talking about similarity in prices?
|
Well, not necessarily. Figure 2 shows some returns for GE stock. One chart,
the right or the left, shows the distribution of daily returns and the other, the distribution
of weekly returns. Which is which?
>You don't have any scale. If you put some numbers in then ...
>You get similarity?
|  Figure 2 |
We'll talk about self affinity later ...
Here's a couple of pictures. One is of real, live daily stock returns. The other is generated via random selection from a Normal distribution with the same Mean and Volatility. Which is which?

To get one chart I downloaded daily prices, hence returns, from Yahoo. For the other I generated returns via Excel, using NORMINV(RAND(),M,S) where M and S were the Mean and Standard Deviation of the downloaded returns.
Which is real and which is fake?
>zzzZZZ
See the difference? The upper one has some huge daily returns, both positive and negative.
The bottom chart doesn't. Indeed, the upper chart has returns over five Standard Deviations from the Mean and,
for a Normal distribution, that should happen once every 20,000 years or so, but ...
>Huh? But ... there are several huge returns in the upper chart.
Yes. It's a chart of a thousand daily returns for GE (from 1999 to 2003) and a plot of a $1.00
portfolio of GE stock.
On the other hand, the fake chart, the bottom one, the one with Normally distributed returns - it has the expected "mild" deviations from the Mean, rarely wandering more than a couple of Standard Deviations.
To get those wild variations we should could use the actual historical returns, randomly selected
... rather than a Normal distribution proxy - like so:

|
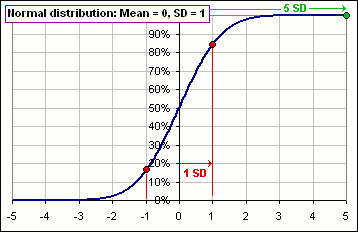
Figure 3 shows the standard Normal distribution. The probability of being less than 1 Standard Deviation
above the Mean is 84.1% and the probability of being less than 1 SD below the Mean is 15.9%
so 84.1% - 15.9% = 68.3% lie within 1 SD of the Mean. And 95.4% lie within 2 SD and 99.7% lie within 3 SD
and ...
>And it'll take 20,000 years to get 5 SD from the Mean, eh?
>You said every 20,000 years.
|  Figure 3 |
So the accepted ritual of selecting returns from a Normal (or Lognormal) distribution will rarely give
returns that deviate far from the Mean.
>So discard that accepted ritual, eh?
That's Mandelbrot's contention.
>Does he have a replacement? It's no good to discard something unless you can replace ...?
Yes, yes, he suggests a replacement. It's called a ...
>A fractal?
A multifractal ...
>Mamma mia.
What Mandelbrot suggests is something like this (in order to generate a price chart):
>Okay, I get the idea. However, on a "down" leg, the interpolation is inverted: down/up/down instead of up/down/up. Anyway, after umpteen of these interpolations, we stand back and look at what we've created. Guess what it looks like? >My portfolio? |  Figure 4 |
This idea of smaller things within larger things and so on and so on ... it's enshrined in the poem:
Great fleas have little fleas, upon their backs to bite 'em
And little fleas have lesser fleas, and so ad infinitum,
And the great fleas themselves, in turn, have greater fleas to go on,
While these again have greater still, and greater still, and so on.
| Self Affinity |
Self similar refers to similarity when the object is reduced in size in different directions by the same reduction factor.
For example, if we reduce the horizontal and vertical scales, a circle remains a circle.
On the other hand, self affine refers to similarity when the object is reduced in size in different directions by different reduction factors.
A circle may become an ellipse. A square may become a rectangle. A sphere may become an ellipsoid.
Suppose R(t) is a random variable, at time t.
Then, for some constant c, how does R(ct) compare to R(t)?
>Huh?
R(t) may be the daily return of some stock, at t days after t = 0.
Or, perhaps more common, R(t) = log(P(t)/P(0)), the log of the gain over t days (or weeks or months).
What about the gain at time 2t or 3t or ...?
>Yeah, so what is it?
Notice that ct is the time, rescaled by the factor "c".
If the returns were self affine, then R(ct) would be not only have time rescaled (that's the horizontal scale),
but also the gain rescaled (that's the vertical scale).
That'd mean that:
[1] R(ct) = M(c)R(t).
>What's M(c)?
Well, besides the fact that it's assumed to depend upon the time scale "c", it wouldn't be constant else
we would know R(ct) once we knew R(t) ... and that makes no sense.
In fact, to be meaningful, the scaling factor for R, namely M(c), should itself be a random variable.
And (with Mandelbrot) we assume that the relation R(ct) = M(c)R(t) is independent of which time "t" is chosen.
In particular, in R(ct) = M(c)R(t), we put c = c2/c1 and replace t by c1t.
That gives:
[1a] R(c2t) = M(c2/c1)R(c1t) so R(c2t)/R(c1t) = M(c2/c1).
Doing this again, we can get:
[1b] R(c3t) = M(c3/c2)R(c2t) so R(c3t)/R(c2t) = M(c3/c2).
NOW, if c3/c2 = c2/c1
... so that M(c3/c2) = M(c2/c1) ...
then (from [1a] and [1b]) we get:
[1c] R(c2t)/R(c1t) = R(c3t)/R(c2t) if c3/c2 = c2/c1.
>What exactly are we doing?
We're trying to determine the characteristics of a self affine random distribution.
>Did you say we?
Well ... uh, we're just following Mandelbrot. He says that [1] characterizes a particular class of multifractals.
It's a global property.
However, we ... uh, Mandelbrot wants a local propertry as well.
To this end he defines a local scaling rule, namely:
[2] R(t+cΔt) - R(t) = M(c)[R(t+Δt) - R(t)]

| Chaos in Financial Markets |
For more than you ever wanted to know about chaos ... J.C. Sprott
For centuries it was accepted that, if you knew how some physical system started (the initial conditions), you could predict the future evolution of the system. Laplace (1749-1827) said:
"The present state of the system of nature is evidently a consequence of what it was in the preceding moment, and if we conceive of an intelligence which at a given instant comprehends all the relations of the entities of this universe, it could state the respective positions, motions, and general effects of all these entities at any time in the past or future."However, in the early twentieth century, Poincare (1854-1912), anticipating the more recent theory of "Chaos", noted that:
"It may happen that small differences in the initial conditions produce very great ones in the final phenomena. A small error in the former will produce an enormous error in the latter. Prediction becomes impossible"
>So what's this chaos stuff?
It just points out the fact that, in many systems, very small changes can result in very large results.
>I haven't the faintest idea ...
You start with a number 1.234, execute some numerical procedure and end up with 10.567.
What change would you expect in that final number had you started with 1.235?
>Not much.
But suppose you ended up with 27,585,966.43?
>Chaos?
Chaos.
The classical example has to do with weather prediction. A butterfly in Africa flaps its wings and
a hurricane evolves in the Gulf of Mexico. Tiny variation in Africa. Huge result in the Gulf.
>Is that true? The butterfly, I mean?
I doubt it, however the point is made that it's diffult to make predictions if there is a great sensitivity
to variation in initial conditions.
Remember this picture from Part I?


