| Reversion to the Mean: Part II a continuation of Part I. |
We'll consider:
- a bunch of numbers: x1, x2, ... xN
- Their mean: M = (1/N) (x1+x2+...+xN) = (1/N) Σ xk
- The deviation between any single number, xn, and the mean of all the numbers: en = xn - M
- And, finally, the average or Mean Square of these deviations:
(1/N) Σ en2
called the Variance of the numbers x1, x2, ... xN.
>Wait! Why do you call this tutorial Reversion instead of ...?
In Part I we had two sets of numbers:
the father's heights {x} and the son's
heights {y} and when we plotted
(x,y) we saw a sort of linear, straight line relationship so
we did a Regression Analysis a la Francis Galton. Now we're going to consider a
single sequence of numbers,
x1, x2, ... xN
(which we'll often refer to as simply {x}, for sanitary
reasons). These will, in our discussion, be a sequence of stock prices or maybe
monthly percentage changes in stock price, or maybe the logarithms of stock prices, or maybe ...
>Yeah, yeah, but why Reversion?
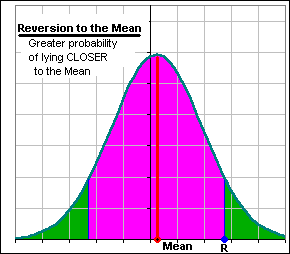
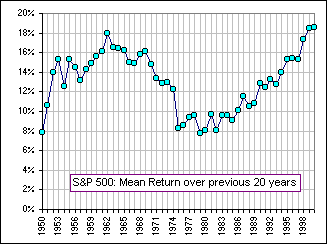
In market-speak, it's more often called Reversion to the Mean.
Okay, let's consider:
| SD2 | = (1/N)Σ en2 |
| = (1/N)Σ { xn - M}2 | |
| = (1/N)Σ {xn2 - 2 xnM + M2 } | |
| = (1/N) Σ xn2 - 2 {(1/N)Σxn }M + (1/N)ΣM2 ... and (1/N) Σxn = M | |
| = (1/N) Σ xn2 - 2 M2 + (1/N) NM2 ... since ΣM2 = M2+M2+...+M2=NM2 | |
| = (1/N) Σ xn2 - M2 |
|
This is so important we'll give it a position of respect:
If we stare at this hard enough we see a2+b2=c2 which
reminds us of Pythagorus.
|  Fig. 1 |
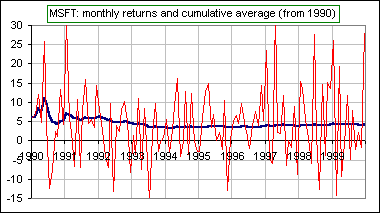 Fig. 2 |
>Can we get back to Reversion to the Mean? Okay. We'll look at all the 120 monthly Returns for Microsoft, from Jan 1, 1990 to Dec 31/99. We'll also calculate the average of the monthly Returns from Jan/90 to Jan/90, then from Jan/90 to Feb/90, then from Jan/90 to Mar/90, then etc. etc. from Jan/90 to Jan/00. There are 120 of them, too. Then we'll plot both the monthly Returns (shown red) and that moving, cumulative average (shown in blue). The moving average approaches a number a bit more than 4% ... actually 4.3%. |
Uh ... no. Nevertheless, when investment analysts do refer to Reversion to the Mean they usually do mean that high-flying stocks will eventually regress to some Mean or Norm.
For example, here it says:
- Vanguard Senior Chairman
John C. Bogle warned investors about reversion to the mean, which is the tendency over time of investment returns
to move toward a norm, or mean. This "investment law of gravity"—applies not only to the relative returns of
equity mutual funds, but also to returns of stock market sectors and to returns of common stocks as a whole.
- ... over long periods such as the 20, 30, or even 40 years during which people invest for retirement, "it is an odds-on bet that a fund's gross rate of return will approximate that of the stock market." . The usual measure of this "mean" is a market index. "Most investors are completely unaware that today's top performers are overwhelmingly likely to be tomorrow's ordinary participants in the stock market."
|
>"Reversion" means average Microsoft returns will
approach the average S&P 500 Returns, right? Let's see about that. We'll plot the Moving Average (extending back to Jan/90) of both MSFT monthly Returns and S&P monthly Returns. They both approach some "Norm", but they aren't the same Norm. | 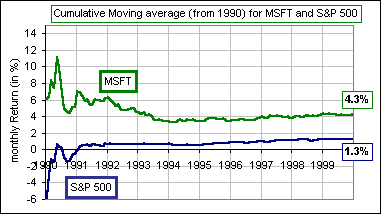 Fig. 3 |
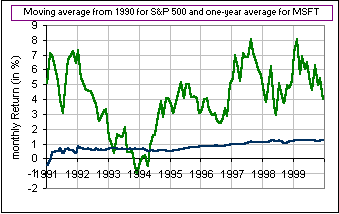 Fig. 4 |
>So what does "Reversion" mean? Maybe going back to 1990 is overkill. Maybe ... Okay, we'll just track the trailing one-year moving average for Microsoft, starting in Jan/91. That is, for Jan/91, we'll calculate the average monthly Return from Jan/90 to Jan/91, then for Feb/91 we calculate from Feb/90 to Feb/91, then from Mar/90 to Mar/91, etc. etc. and we'll compare to the long-term market average, meaning the S&P moving average ... from Jan/90 onward. The latter blue S&P curve is the same as in Fig. 3 (but it starts in 1991). |
Hmmm ... no.
>Maybe Microsoft is a bad example, eh?
Maybe ... but here's GE, an old, Blue Chip stock that's been around forever:

(See Average and Annualized returns.)
>Should you consider longer time periods, like 20-30-40 years?
Maybe. Here's some 30-40 years:

- In the left chart, we compare the moving Annualized Return (using monthly returns over the previous two years) for GE ... and the Annualized Return for the S&P 500 (using all the data back to 1962 in order to get some long term historical market perspective).
- In the right chart we follow the long term Annualized Return for both, using data from 1962.
>Any Regression there?
Your guess is as good as mine.
>How about a Mutual Fund, instead of a single stock?
Okay, here's a MF, compared to the TSE:

>Any Regression there?
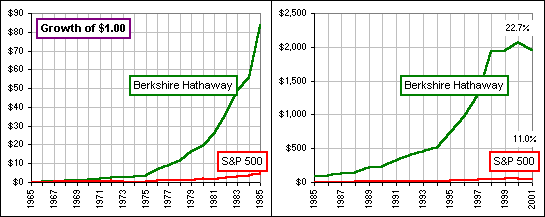
Your guess is as good as mine. Here's another. Buffett wouldn't be happy to suffer
some kind of inevitable reversion:
>Can't you find a single example where a stock gets sucked to some "Norm" and ...?
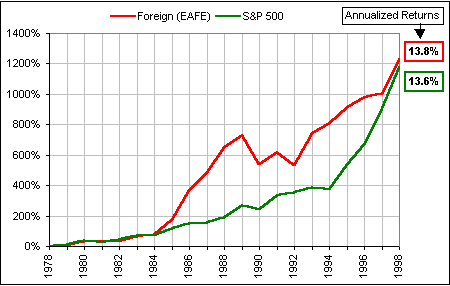
Here's one where an errant Europe, Australasia, Far East Index (EAFE) gets sucked back
to the S&P 500:
>Now that's one Mean Reversion, eh?
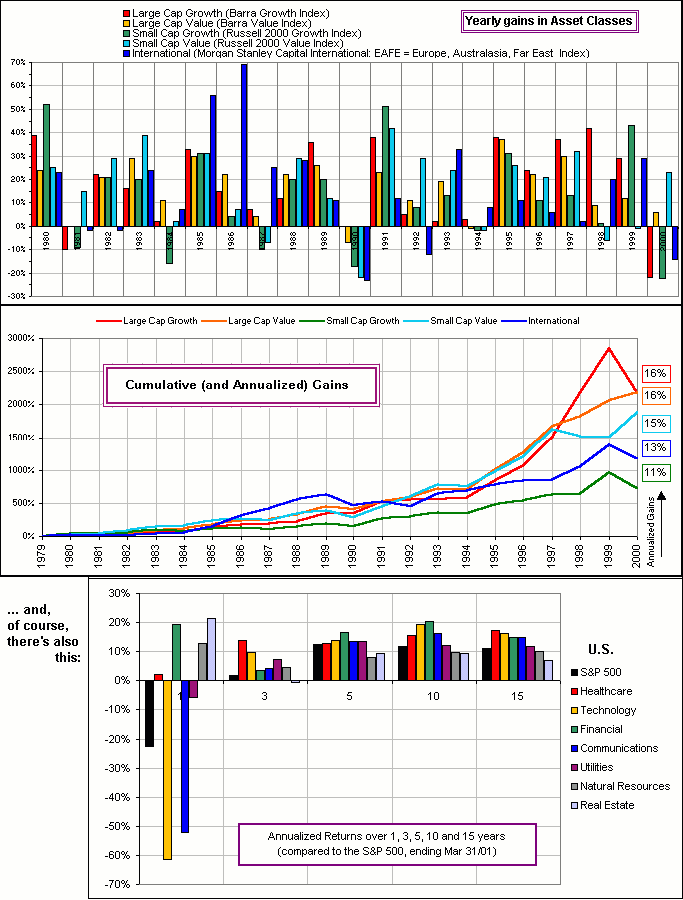
Amen. In case you're interested, maybe you can find Reversions here:
>Maybe you just don't know what is meant by Mean?
That's a distinct possibility. Maybe the investment community uses some definition of Mean
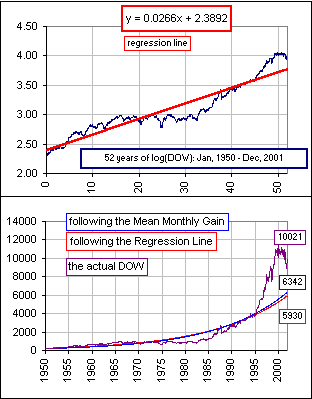
that I don't know or understand. For example, if we use the averaging involved in the
Regression Line (for 52 years of the DOW, fitting the Line to log(DOW)) and compare to using
the Mean of monthly returns ... we get two different values that the DOW might
"revert" to:
>So, maybe I should choose my own, personal definition of Mean?
Be my guest.

