| Ordering the S&P 500 and assorted musings |
|
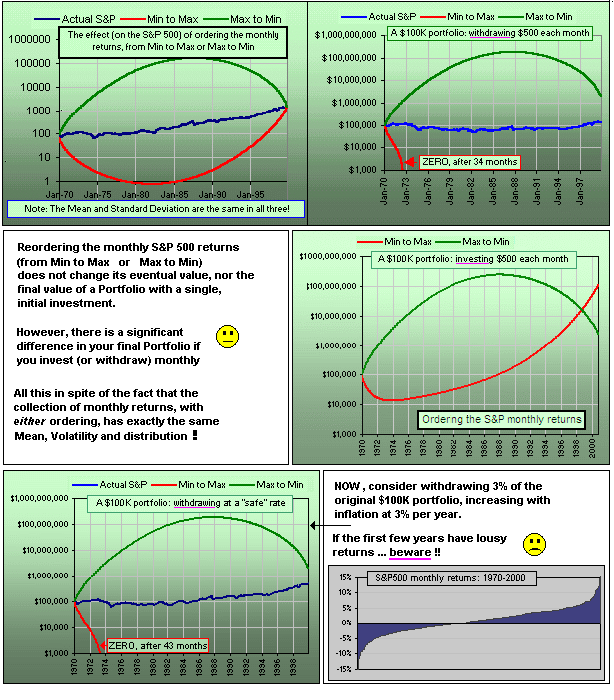
Once upon a time I was considering the monthly S&P 500 returns and generated the upper part of the chart to the right
in order to illustrate that, with the same set of returns, hence the same Mean and Standard Deviation and distribution,
one could reorder the returns to achieve wildly different results for a portfolio with monthly investments or withdrawals.
>But that's pretty silly, eh? I mean, it's unlikely to ...
>It's amusing ... but improbable.
>Yeah, I can see the chart. But it's fiction, right?
>Exactly what I was going to suggest!
>Monthly? What about annual rebalancing?
| 
|
|
>What about the bond component? Is it ...?
It's not that important exactly what it is ... >What it was. Yes, what it was. Here's a picture of the monthly returns, from Min to Max, over the period 1970 - 2000:
The important point is the consequence of changing the mix of Stocks and Bonds.
I considered x% S&P500 and 100 - x% Bonds and (for example) a 3% withdrawal rate increasing at a 2.5% annual inflation rate, then reordered the monthly returns from Minimum to Maximum then from Maximum to Minimum. As we decrease the stock component (hence the volatility | 
|
>Quite suddenly? When?
There's a spreadsheet to play with. Just keep decreasing the Stock component and, if the other parameters are appropriate, you'll see your portfolio survive.
To get the spreadsheet: RIGHT-click
here and Save Target.
However, this is fiction, remember? This is history ...
>A reconstructed history.
I'm glad you noticed.
| reOrdering Returns and Safe Withdrawals and other musings |
When you try to estimate the probability that your portfolio will survive 30 years (withdrawing at, say, X% per year, increasing with inflation), there are three ways (at least!) to do it.
- Look at the worst 30-year period in history and assume that the future will be no worse than the past.
(That will probably give a "Safe" withdrawal rate of about 4%. See the calculator here) - Look at the returns over the past umpteen years and select 30 at random
(along with some inflation rate, perhaps selected randomly from historical data. See the calculator described here)
Then repeat this 30-year selection a jillion times and count the number of times the portfolio survived 30 years. - Assume some Average Return and Volatility (perhaps from historical data) and assume some distribution of Returns (like normal or lognormal) and pick 30 random returns from this distribution ... then repeat this 30-year selection a jillion times and count the number of times the portfolio survived 30 years. (See the calculator described here)
|
>That's it?
Oh, I'm sure there are others ... but I just want to make a point. >Which is? It's just that, although all three give reasonably safe withdrawal rates in the neighbourhood of 4%, the reordering of returns (as in ritual number 2, above) will have much worse (and much better) possibilities than ritual #1. For example, for the 30-year period from 1930 to 1959 an S&P500 portfolio would have had a safe withdrawal rate of 4.08% (using actual returns and inflation rates
for those years).
By interchanging the returns (and inflation) for just two years, namely years 1933 and 1937, the "safe" withdrawal rate drops to just over 3% >What's that reasonably safe stuff?
| 
|
That depends upon your genetic configuration.
>So, if I were to calculate a "reasonably safe" withdrawal rate, would I do this in January in order to ...?
In order to determine how much to withdraw for the coming year? I have no idea how you would use that number.
|
>Your 1930-1959 example, just after the crash of '29, is a bit far fetched, eh?
Here's a more recent example (for a $1.00 S&P portfolio): 
The safe withdrawal rate was 6.3% (assuming a constant 3% inflation).
>C'mon. From Min to Max? That is far fetched.
Assuming some distribution of reorderings, can one determine the most probable outcome? | 
|
Well, in another tutorial we talked about a magic formula for the SWR over N years, namely:
| SWR = 1/{ I1/G1 + I2/G2 + I3/G3 + ... + IN/GN } |
and Gk = (1+r1)(1+r2)...(1+rk) (r1, r2, ...are the annual returns)
>So?
So we reorder the inflation rates and returns and see what happens to SWR.
>And that'd be useful?
I have no idea.
>Okay, so we reorder a jillion times and ask the question "What's the most probable outcome"?
Something like that.
>And what's the answer?
I have no idea.
>That seems to be your favourite answer!


 ) we arrive a point where, quite suddenly,
even the worst possible sequence of returns yields a portfolio which survives thirty years!
