1

Bollinger Bands |
2

Moving Averages |
3

Exponential Moving Averages & MACD |
4

DMI and Trends |
5

Willams %R |
6

Zweig 4% Rule |
7

Parabolic fit |
8

Some "Waves" |
9

Elliott Waves |
10

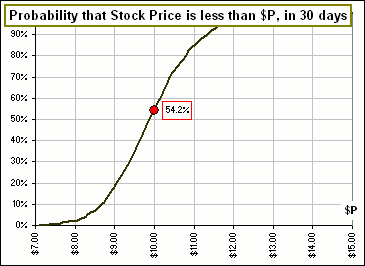
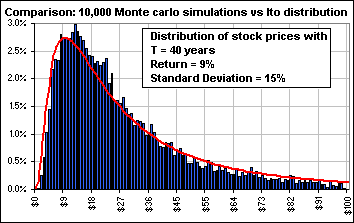
Monte Carlo |
11

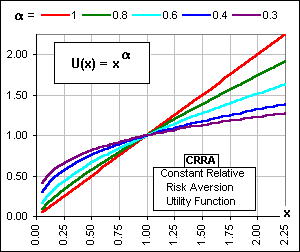
Utility Stuff |
12

Efficient Frontier |
13

Value at Risk |
14

gRank & assorted Ratios |
15

Cointegration |
16

Fractal Stuff |
17

Spearman Correlation |
18

ADX |
19

Omega |
20

Liquidity Ratio |
21

Seasonality |
22

Johnson Distributions |
23

Aroon Indicator |
24

Hikkake & Candlesticks |
25

rMA stuff |
26

P&F Charts |
27

Traffic Lights |
28

Sortino Ratio |
29

Correlations |
30

Stochastic Dominance |
31

Short Interest |
32

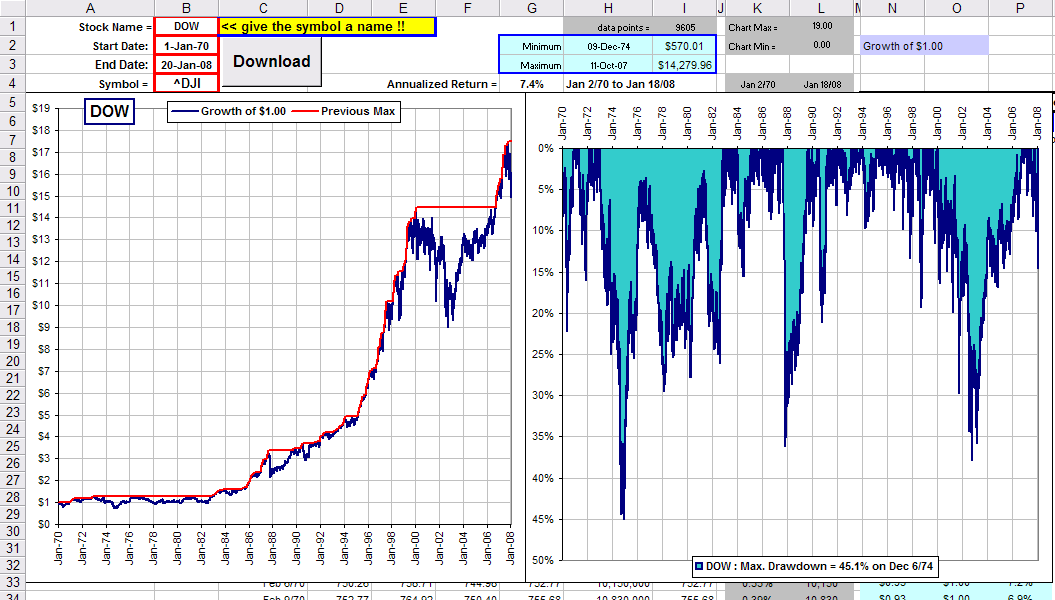
Drawdown Risk |
33

Dividends |
34

Trends |
35

Volatility Stuff |
36

Predicting Prices |
37

Beta |
38

Gann Charts |
39

Average True Range |
40

Pairs Trading |
41

Principal Component Analysis |
42

Pivot Points |
43

Correlations |
44

Copulas |
45

What's Hot |
46

Velocity of Trades |
47

Excel-Download a Webpage |
48

Sister Stocks |
49

Maximum Rate of Withdrawal |
50

DCA vs All-at-once |
51

September !! |
52

Principal Component Analysis |
53

Delta-Hedging |
54

a Magic Sum |
55

Average returns depend upon the day-of-the-month |
56

Momentum |
57

Raff Regression |
58

Reincarnation: which is your portfolio? |
59

Download Stock Data |
60

Stutzer Index |
61

Price & Return Correlation |
62

Portfolio Tracker |
63

Regression Stuff |
64

R squared |
65

Downside Beta |
66

All Time Periods |
67

Backtesting |
68

Returns Data |
69

Portfolio vs an Index |
70

Buy or Rent? |
71

Ito and Options |
72

Ito Math summary |
73

Moving Averages & Returns Distribution |
74

Kurtosis |
75

Stocks that Talk |
76

Volatility & Trends |
77

Sectors |
78

Displaced Moving Averages |
79

another kind of Index |
80

a Black Swan |
81

the Stock and the Pillow |
82

Multiple Stock Download |
83

Download & Calculate |
84

Market Crashes |
85

Expense Tracker |
86

the Ulcer Index |
87

Donchian Channels |
88

Money Management |
89

Modified Bollinger Bands |
90

Return on Investments: IRR? XIRR? Other? |
91

Rebalance: Yes orNo? |
92

Compare this month to a historical month |
93

More Drawdown |
94

Volatility Pumping |
95

a Buy & Sell Strategy |
96

Daily Stock Activity |
97

Correlations for 60 stocks |
98

What Correlation? |
99

CAGR vs Volatility |
100

CAGR versus Drawdown |
101

ADX |
102

Download Open, High, Low & Closing Prices |
103

an Adjusted Cost Base calculator |
104

Predict the Future by comparing to the Past |
105

Technical Analysis |
106

Daily Stock Activity |
107

Cousin Stocks |
108

When is Easter  |
109

Stock Oscillations |
110

Penny Stocks |
111

Sorting stock stuff |
112

Wavelets |
113

NAV for ETFs |
114

Chaikin Oscillator |
115

Path Volatility |
116

Best Predictors (?) |
117

Bonds or Stocks? |
118

Other Moving Averages |
119

the Duffing Oscillator |
120

the DOW vs the World |
121

Gains & Losses |
122

Monte Carlo before Retirement |
123

another Moving Average |
124

Market Crashes ... a la Sornette |
125

Candlesticks & Crashes |
126

Musing on the Future |
127

Stock Comparisons & Correlations |
128

Regression Line as a magnet |
129

Safe Withdrawal Rates (again!) |
130

Option things |
131

Buy & Sell Calculations |
132

on Missing Days or Months |
133

the Evolution of your Portfolio |
134

Cheap stocks in a meltdown ... maybe. |
135

Calculate a bunch of Volatilities |
136

Selling Covered Call Options |
137

Volatility smiles |
138

DOW futures: what are they? |
139

Turtle Trading |
140

200-day Moving Average |
141

Historical Foreign Exchange Rates |
142

Historical Dividends |
143

High/Low Oscillator |
144

200 day Moving Averages |
145

Standard Errors and the K-Ratio |
146

Heikin-Ashi candles |


