|

Click for last five days of SP/TSE 60. ( XIU* is roughly 10% x SP/TSE60.) |
| #1 | Company2 | Price3 | EPS4 (Growth) | P / E | Price/ Book | 52-wk High | 52-wk Low | (P-Lo)/ (Hi-Lo) | Debt/ Equity | Mkt Cap $Mil | Mkt Cap Weight (Rank) |
| 01 | Abitibi-Consolidated (A) | ||||||||||
| 02 | Agrium (AGU) | ||||||||||
| 03 | Air Canada (AC) | ||||||||||
| 04 | Alberta Energy Company (AEC) | ||||||||||
| 05 | Alcan (AL) | ||||||||||
| 06 | Anderson Exploration (AXL) | ||||||||||
| 07 | ATI Technologies (ATY) | ||||||||||
| 08 | Bank of Montreal (BMO) | ||||||||||
| 09 | Bank of Nova Scotia (BNS) | ||||||||||
| 10 | Barrick Gold (ABX) | ||||||||||
| 11 | BCE Inc. (BCE) | ||||||||||
| 12 | Biovail (BVF) | ||||||||||
| 13 | Bombardier Inc. (BBD.B) | ||||||||||
| 14 | Brascan Corp. (BNN.A) | ||||||||||
| 15 | CAE Inc. (CAE) | ||||||||||
| 16 | Canadian National Railway (CNR) | ||||||||||
| 17 | Canadian Natural Resources (CNQ) | ||||||||||
| 18 | Canadian Pacific (CP) | ||||||||||
| 19 | Canadian Tire Corporation (CTR) | ||||||||||
| 20 | Celestica Inc. (CLS) | ||||||||||
| 21 | CIBC (CM) | ||||||||||
| 22 | Dofasco Inc. (DFS) | ||||||||||
| 23 | Domtar Inc. (DTC) | ||||||||||
| 24 | Enbridge (ENB) | ||||||||||
| 25 | Falconbridge Ltd. (FL) | ||||||||||
| 26 | Franco-Nevada (FN) | ||||||||||
| 27 | Gulf Canada Resources (GOU) | ||||||||||
| 28 | Hudson's Bay Co. (HBC) | ||||||||||
| 29 | Husky Energy (HSE) | ||||||||||
| 30 | Imperial Oil (IMO) | ||||||||||
| 31 | Inco Ltd. (N) | ||||||||||
| 32 | Loblaw Companies (L) | ||||||||||
| 33 | Magna International (MG.A) | ||||||||||
| 34 | Manulife Financial (MFC) | ||||||||||
| 35 | MDS Inc. (MDS) | ||||||||||
| 36 | Mitel Corp. (MLT) | ||||||||||
| 37 | Molson (MOL.A) | ||||||||||
| 38 | National Bank of Canada (NA) | ||||||||||
| 39 | Nexen (NXY) | ||||||||||
| 40 | Noranda Inc. (NOR) | ||||||||||
| 41 | Nortel Networks Corp. (NT) | ||||||||||
| 42 | Nova Chemicals Corp (NCX) | ||||||||||
| 43 | Petro-Canada (PCA) | ||||||||||
| 44 | Placer Dome (PDG) | ||||||||||
| 45 | Potash Corp. of Saskatchewan (POT) | ||||||||||
| 46 | Precision Drilling (PD) | ||||||||||
| 47 | Quebecor World (IQW) | ||||||||||
| 48 | Rogers Communications (RCI.B) | ||||||||||
| 49 | Royal Bank of Canada (RY) | ||||||||||
| 50 | Shaw Communications (SJR.B) | ||||||||||
| 51 | Sun Life Finl Svcs Canada (SLC) | ||||||||||
| 52 | Suncor Energy (SU) | ||||||||||
| 53 | Talisman Energy (TLM) | ||||||||||
| 54 | TD Bank (TD) | ||||||||||
| 55 | Teck Corp. (TEK.A) | ||||||||||
| 56 | TELUS (T) | ||||||||||
| 57 | Thomson Corporation (TOC) | ||||||||||
| 58 | TransAlta Corp. (TA) | ||||||||||
| 59 | TransCanada PipeLines (TRP) | ||||||||||
| 60 | Westcoast Energy (W) | ||||||||||
(Hi-Lo) | |||||||||||
# | 41 | 17 | 28 | # | 40 | 7 | 3 | 3 |
|||
# | 33 | 50 | 3 | # | 27 | 3 | 41 | 41 |
1: Click on company# to get a window with a 1-year chart. Be neat: CLOSE the window after viewing 
2: Click on Price to get a window with a 5-day chart ... and close the window after viewing.
3: Click on company name to get company info.
4: Most recent annual EPS ... and 3-year annual Earnings Growth as of last fiscal period.
5:
The {Total Mkt Cap} /
{Total Earnings}
(See P/E Ratios)
(Negative Earnings are included.)
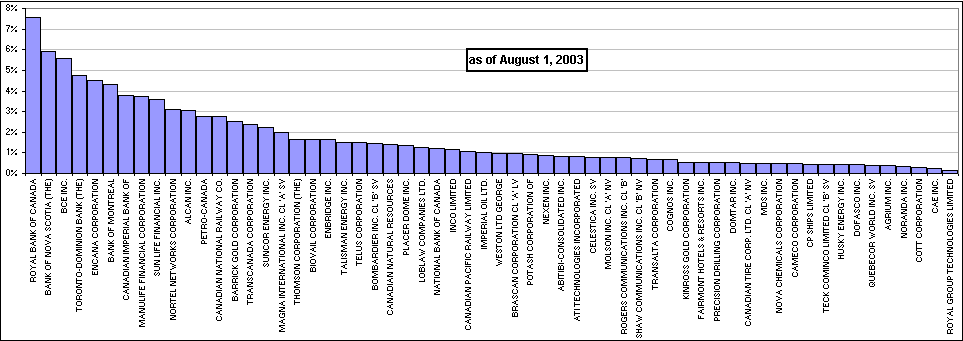
TSE 60: Ranking by Market Capitalization (on or about June 20/01)
|
Sector Weights (Feb 28/01)
|
NT | RY | BCE | BBD/B | TD | BNS | BMO | MFC | CM | AL | CP | SLC |
CNR | PCA | CLS | ABX | AEC | SU | TOC | TRP | BVF | TLM | T | SJR/B |
MG/A | GOU | ENB | CNQ | NA | PDG | L | A | IMO | N | NXY | POT |
TA | AXL | W | BNN/A | RCI/B | IQW | FN | PD | CAE | ATY | NCX | MDS |
MOL/A | NOR | HSE | DFS | AGU | CTR/A | DTC | MLT | TEK/B | FL | HBC | AC |
|
|
|
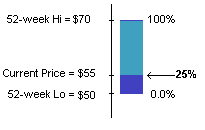
Note:
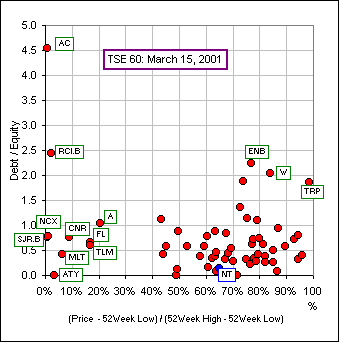
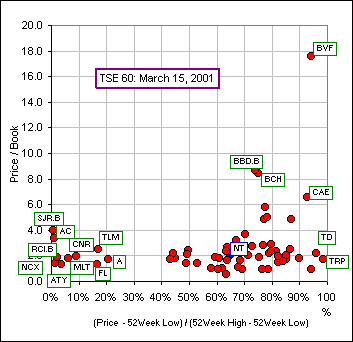
indicates how close the Price is to the
52 Week Low, like so:
|
|
 the TSE 60
