| Volatility ... or Standard Deviation |
There's this thing called Standard Deviation (or Volatility) which measures how far a set of stock returns tends to deviate from their Average or Mean.
To calculate the Standard Deviation you do this:
- Calculate the Mean (or Average) of the set of returns: R1, R2, ... Rn.
M = (1/n) ( R1 + R2 + ... + Rn) - Then calcuate the deviations from this Mean:
(R1 - M) and (R2 - M) and ... (Rn - M) - Then calculate the average of these squares:
SD2 = (1/n) { (R1 - M)2 + (R2 - M)2 + ... + (Rn - M)2 } - The square root of this average is the Standard Deviation, SD.
(You might call it the Root-Mean-Square of the deviations from the Mean.)
| SD2 = (1/n) ΣRk2 - M2
= (The average of the squares of the returns) - (The square of the average return)
where Σ is a shorthand notation for summing of terms |
>And that's useful?
To many, it represents how far the monthly (weekly? yearly?) returns deviate from their Mean.
For something like bank interest, where the annual returns are constant, then SD = 0 since all returns are equal to their Mean.
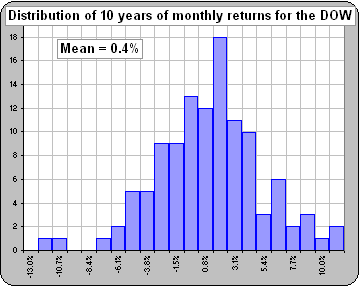
For something like the DOW, you might have SD = 0.1 or 10%.
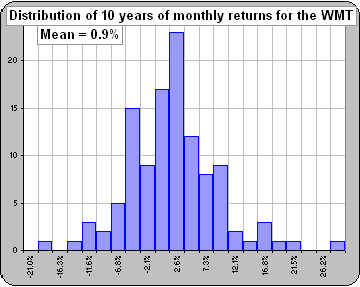
For something like the WMT (Walmart), you might have SD = 0.15 or 15%.
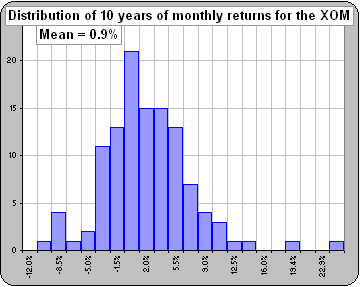
For something like the XOM (Exxon), you might have SD = 0.2 or 20%.
For something like ...
>20% of what?
Good question.
If you're calculating the Standard Deviation of a set of temperatures, then SD would be measured in degrees.
If you're calculating the Standard Deviation of a set of areas, then SD would be measured in square metres.
>So the SD for stock return percentages would be a percentage.
Exactly ... and besides being a measure of how the returns are dispersed (about their Mean), many regard the SD as a measure of Risk.


>A measure of Risk? As in losing money?
No, as in being uncertain of the expected future returns ... since you may expect them to vary greatly if the Volatility is large.
Of course, it wouldn't be MY definition of Risk. Indeed, people are still discussing what is the "best" (in some sense) measure of Risk.
These debates seem to go on ... and on.  (See Poor Joe.)
>The distribution of returns ... that looks interesting.
Yes. We'll talk about distributions soon enough.
One thing you have to consider (before placing too much faith in what the SD is saying) is that, if you use monthly returns,
the value will depend upon whether you take the return from the 1st of the month to the 1st, or the 10th to the 10th, etc.
That goes for a number of financial indicators, like Correlation or Beta ... or whatever.
If one is accustomed to seeing the Volatility of yearly returns, then one often multiplies the monthly volatility by the square-root-of-12 (because there are 12 months in a year).
Indeed, if you have the volatility for weekly returns, then multiply by the square-root-of-365 (because there are 365 days in a year).
Note, however, that some multiply by the square-root-of-250 because there are (about) 250 market days in a year. 
>And that'd give the same number as you'd get by using yearly returns?
Uh ... no, but usually it's close.
However, so long as everybody uses the same prescription for "annualizing" monthly volatility then you can at least compare volatilities between assets.
One other thing about volatility: If you have two assets with the same Mean, the one with the larger volatility will make you less money.
>Huh?
Increasing Volatility will reduce your Compound Annual Growth Rate (CAGR or "annualized" return)
... but we'll talk about that later. 
See:
- What's "Risk"?
- Risk and Volatility
- Time Diversification
- Drawdown as "Risk"
- the Ulcer Index as "Risk"
- Dependance upon WHEN things are calculated
- Correlation vs Days
- Square root of time
- Volatility and Square-root-of-Time
- Volatility and Returns
- Volatility, Risk and "Risk"
- Volatility and time period
- Measuring "Risk"
- Volatility: good or bad?
- CAGR and Volatility
- Yet another measure of "Risk"
|
|
 to continue