| Price Probabilities |
| Investors always hope to estimate the price of a stock at some time in the future and ...
>Fat chance!
>For example?
>Huh? Do some calculations?
| 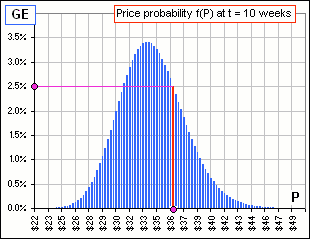 Figure 1 |
Uh ... no. It's the probability of having the price P lie in small intervals. See the small intervals in Figure 1? They're about $0.28 wide.
For example, I've coloured one of them red so we conclude that there's a 2.5% probability that the price will lie between $36.00 and $36.28.
>And where did that magic formula ...?
It came from here.
>And you have faith in that formula?
That's irrelevant! I'm assuming that somehow we've managed to come up with a price distribution.
You might, for example, use Monte Carlo as was done here.
Okay, suppose we have the distribution. Let's call it f(P).
Then f(P)dP gives the fraction
(or percentage, if we multiply by 100)
of stock prices that lie in an interval of width dP, about the price P.
Now suppose that we have some other quantity, Q(P), that depends upon
P (like a gain or loss or the value of an option etc.).
We can then calculate the Expected Value of this other quantity by using: SUM[Q(P)f(P)d(P)].
>Huh?
For each of a jillion values of P, we calculate Q(P)f(P)d(P) and then we add them all up.
For the math-types, that's integrating ... like so: 
where "a" and "b" are the minimum and maximum prices that occur (or just use 0 and ∞).
>And what does that give you?
I told you! It gives the Expected Value of that other thing, Q(P).
For example, look at Figure 2. For each P we plot Q(P)f(P)d(P) using the distribution in Figure 1.
>And what's the SUM you talked about? What does it look like as you add more and more terms?
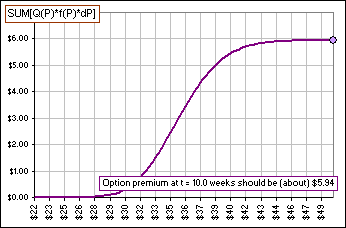 Figure 3 | 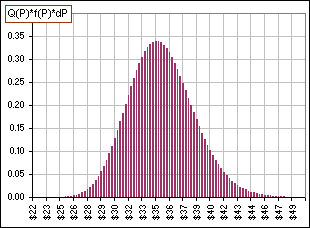 Figure 2 |
>But what's Q(P)?
Well, it happens to be the option premium for GE stock at a time when the premium is about $5.00 ... but that's irrelevant.
I just wanted to illustrate that, in this case (for example), the expected value is about $5.94 as illustrated in Figure 3.
>I think all of this is irrelevant!
Thanks.
Anyway, if y'all want to play you can try a spreadsheet which looks like this ... using options premiums as Q(P):
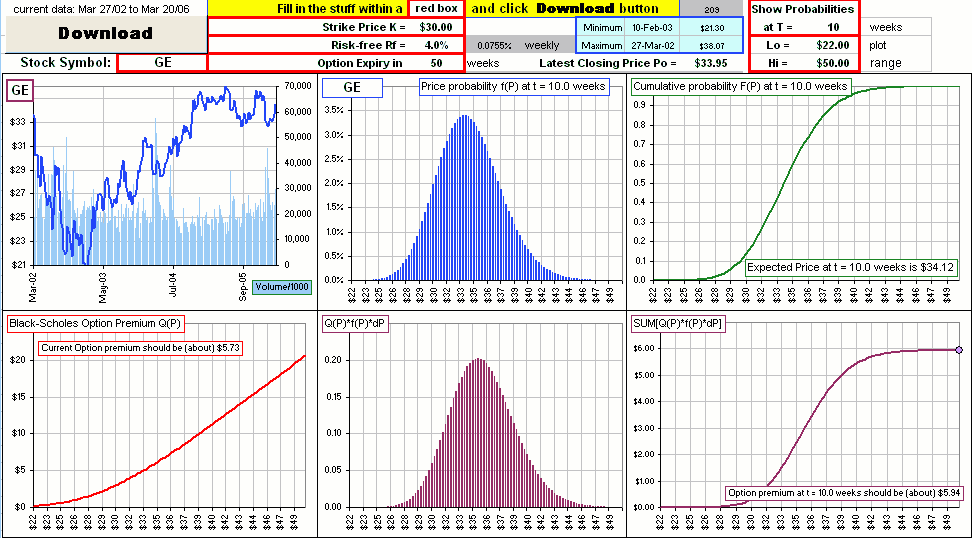
Click on picture to download spreadsheet
>It looks confusing. I mean ...
Not at all. You type in a stock symbol and click the Download button to get four years worth of weekly pirices.
Then you adjust the plot range with Hi and Lo prices so you can see the plots.
Then you enter all the stuff in the red boxes, like Strike Price, Risk-free rate, etc. and pick some time T, in the future.
Then you gaze in awe and admiration at the pretty pictures.
>Yeah, so how do I stick in my option premium?
Well, that's done for you. With the option parameters you've entered in the red boxes, the spreadsheet calculates the premium using Black-Scholes.
>Black who?
Look here. The magic formula, using our current notation, looks like:
| Q(P) = (P*NORMSDIST((LN(P/K)+(Rf+V^2/2)*To)/(V*SQRT(To)))-K*EXP(-Rf*To)*NORMSDIST((LN(P/K)+(Rf+V^2/2)*To)/(V*SQRT(To))-V*SQRT(To))) |
>Personally, I like gain and loss, because ...
That's good. Then you'd just change column Y to read: Q(P) = P - Po and you'd get something like:
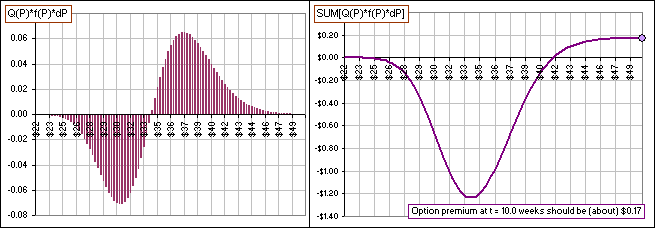
>It still says option premium at 10.0 weeks. I wasn't talking options, I was talking ...
I told you that the spreadsheet uses options as an example. How can it possibly know your Q(P) is gain & loss? Just change the wording yourself.
For example, after a year your Gain / Loss charts would look like:
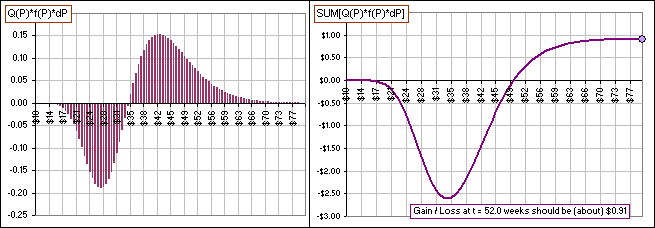
>So I only make $0.91 after one year?
That's an expected value. It could be much higher.
>Or much lower. What about Microsoft or Exxon or ...?
Do it yourself!
However, here's one more:
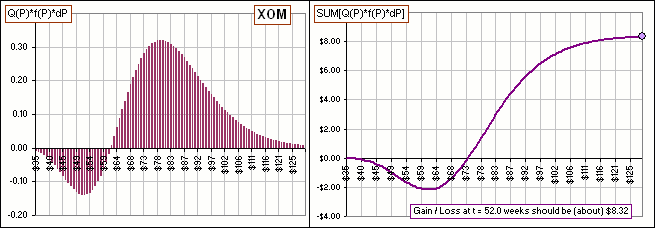
>A Gain of $8.32. Now that's more like it!
So you really believe all this stuff, eh?
>You kiddin'? Black-Scholes and Ito calculus ... mathematics don't lie, do it?


