| TURTL Trading: Part II ... a continuation of Part I |
Okay, here's what we're doing:
Well, that or a multiple of that. Our trades are 1 gST or 2 gST ... or whatever. However, if'n you buy lots of stocks, you'll need lots of money. Here are some DOW stocks 
Note that we calculate APR as a percentage, not a decimal. That is, for a 2.5% average/maximum 20-day variation, we take APR = 2.5, not 0.025. >That COST is what it'd cost to buy that many shares?
>So what's the TOTAL cost?
>So what does gST stand for?
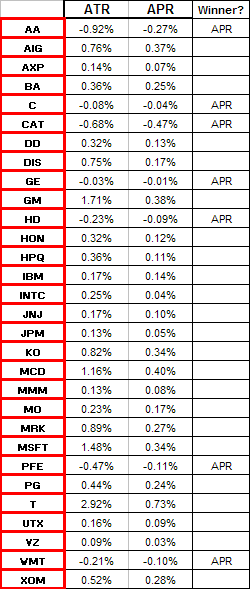
|  Table 1 |
- For two assets X and Y with the same price, if the daily volatility of X (measured by APR) is twice that of Y, then you'd buy half as many shares.
- If the price of X were twice that of Y, you'd invest the same dollar amount in each.
- If you were considering investing in a basket of stocks (perhaps a few of the DOW stocks), then gST would provide an allocation of your Equity.
- There is nothing sacred about a 20-day average. A common average for ATR (or APR?) is 14 days.
- There is nothing sacred about 1% of your Equity. The gST will provide guidance concerning the relative amounts of each asset you'd buy.
- Note that APR*(Stock Price) gives some estimation of the maximum daily variation in stock price.
- If APR = 1.2% and Stock Price = $20, then APR*(Stock Price) = 1.2*20 = 24.
- That suggests that each share of the stock could vary by as much as $0.24 on a given day.
- If you had gST shares of the stock, that'd imply a daily variation as large as gST*APR*(Stock Price).
- If you wanted to ensure that such a daily variation didn't exceed 1% of your Equity, then you'd want to consider having:
gST*APR*(Stock Price) = (1% of Equity). - That'd make:
gST = (1% of Equity) / [ APR*(Stock Price) ] ... which, of course, is the way we defined gST
- If you think that this is the way to preserve your financial health, you might also consider tylenol.
No, there's much more ... but you can read it yourself, here or here or here.
Further, using APR instead of ATR, it ain't Turtle, it's TURTL.
>Aha! I thought that was a typo in the heading of this tutorial. 
I wouldn't want to blame anybuddy for TURTL. It could be a lousy method and ...
>Haven't you backtested it yet?
Patience. I haven't finished. We have to talk about WHEN to buy (or sell).
However, before I do that, let's look at a spreadsheet that'll compare gST for various stocks, like so:
You type in up to 30 stock symbols and click a button and you get a set of associated gSTs and the COST of buying that many shares at the current stock price.
>Aha! That's where you got Table 1, right?
Right. That's using APR rather than ATR.
Look closely and you can see that you should spend twice as much money on AA as AIG: $10K vs $5K.
It's quite a different ratio if you use ATR.
Indeed, their APRs are 10% and 20% so you see that the more volatile stock ...
>And you all believe this stuff?
Of course! Whenever I see a neato mathematical ritual I get all excited and figure "How can it be wrong?"
>Yeah, sure. Is that why your portfolio is down 30% this year?
Shhh ...
|
>So how do things compare when you use ATR instead of APR?
Aaah, good question! We consider the two prescriptions:
That makes them percentages. That makes them independent of the currency. In Japanese yen or British pounds we'd get the same ... >Are you going to answer my question?
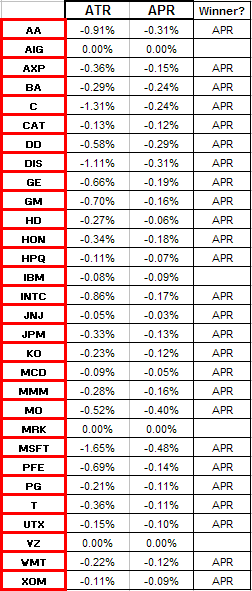
| 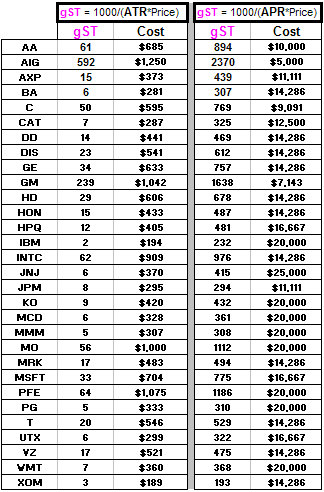 Table 2 |
| When to BUY & SELL |
|
Remember when we talked about Donchian Channels?
>No.
>So what's better? Using ATR or APR? Using an ATR UNIT or an APR gST? Using ...?
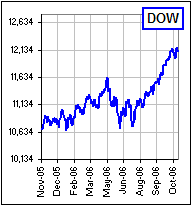
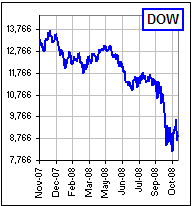
Okay, here's what I get:
| 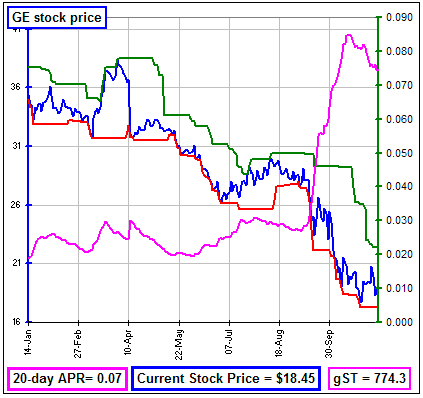  |
>Okay ... so what's better? ATR? APR?
Uh ... can I flip a coin? 


