Predicting the Future ... maybe 
|
Having gazed for some time at historical stock performance, what are the chances that you could use that info to predict the future evolution of your portfolio?
>I'd say zero. Am I right?
Yes, but you can guess ... and there are lots of way to do that:
- Calculate the Mean and Standard Deviation of historical returns and, armed with those two numbers, construct a Normal Distribution.
- Calculate the Mean and Standard Deviation of historical returns and, armed with those two numbers, construct a Logormal Distribution.
- Calculate the Mean, Standard Deviation and perhaps other characteristics of historical returns and, armed with those numbers, construct some other sexy Distribution.
- Use the actual historical returns and select them at random a la Monte Carlo (or some other sexy ritual).
- Use Ito's Magic Formula and ...
If you assume a lognormal distribution (using historical Mean and Standard Deviation) you can try Ito's Formula:
The (lognormal) distribution of Prices P at time T years in the future is:

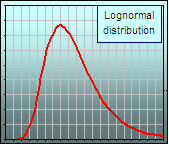
where P is the price T years in the future Po is the current price r is Mean Return s is Standard Deviation |  Shape of the "density" distribution |
>If I have that "density" distribution, how do I use it?
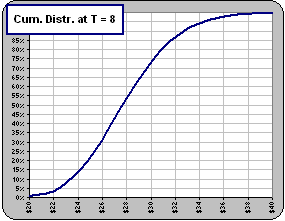
You'll probably want to generate the "cumulative" distribution which will give you the probablility that your stock will attain a certain price, T years from now.
It looks like this:

| Of course, it'll change with T ... and r and s: |    |
Read all about it.

|
>And that'll give me a peek into the future?
It'll give you some numbers. That should make you happy, but predicting the future? Don't count on it! 
Of course, sticking a Mean and Standard Deviation into some formula will give a smooooth curve.
It gives the probability that a future monthly return will be less than something.
>And that's guaranteed?
|  |
|
|
See also:
- a Wave Theory
- Predicting
- The future is like the past

- Using "sister stocks"
- Using Monte Carlo
- Predicting Earnings
- Random markets
- Predicting Market crashes

- Forecasting with Bollinger bands


 to continue