| Pivot Points |
So I get this e-mail that talks about pivot points and ...
>And you never heard of them, right?
No. I mean, yes, I never heard of them, but they seemed interesting so I thought I'd investigate.
The idea is to look at the variations in today's stock prices, the Open, High, Low and Close, and construct a so-called
PivotPoint price, then generate some resistance and support levels using the PP and
the O, H, L and C prices.
|
>Resistance and support?
Resistance and support levels are prices where you expect the stock to have some difficulty in crossing. If they do cross, you might expect some major stock movement as in Figure 1. Note: In addition to resistance and support levels, there are resistance and supports "trends".
With pivot points, we just talk about "levels" ... as in Figure 1.
|  Figure 1 |
Okay. We define, at day's end, a pivot point:
[1a] PP = α1O + α2H + α3L + α4C where α1+α2+α3+α4=1
Then we can define resistance and support levels:
[1b] R = β1O + β2H + β3L + β4C
where β1+β2+β3+β4=1
[1c] S = γ1O + γ2H + γ3L + γ4C
where γ1+γ2+γ3+γ4=1
>You kidding? Am I supposed to pick all those numbers, α1 and α2 and ...
Why not? Or, you can just adopt what others have chosen.
For example, here's one choice:
[2a] PP = (H + L + C)/3 Note that 1/3 + 1/3 + 1/3 = 1
[2b] R3 = (5/3)H - (4/3)L + (2/3)C Note that 5/3 - 4/3 + 2/3 = 1
[2c] S3 = (-4/3)H + (5/3)L + (2/3)C Note that -4/3 + 5/3 + 2/3 = 1
>Where's O?
The Open? It ain't there ... for this particular choice.
|
>Example?
I'm glad you asked. See Figure 2? It's GE, starting on March 10, 2005. The High, Low, Close, Pivot Point, Resistance and Support are shown
>So what do I do now?
>Crossed violently?
>Weak? Strong? Are they technical terms?
|  Figure 2 |
Patience. I said you can have several levels. Remember?
>Yeah. Weak, strong and stronger. I assume there's a spreadsheet to do all this?
Eventually. In the meantime you can play with the spreadsheet that James sent me.
It looks like this:

>I assume I just click ...
Yeah. As usual, you click on the picture.
If you'd like to see what happened in the past, you can play with this guy:

>I take it R1 is some kind of "weak" Resistance and ...
Yes, and R3 is stronger. I've used the following magic formulas to calculate R1 and S1:
[3a] PP = (H + L + C)/3
[3b] R1 = 2*PP - L = (2/3)H - (1/3)L + (2/3)C
[3c] S1 = 2*PP - H = -(1/3)H + (2/3)L + (2/3)C
Note that, in early June we crossed the "weak" support level S1. We pay close attention.
Then, on about June 22 there was a dramatic crossing of the stronger level, S3.
>So we sell?
That's up to you. Remember we're looking at the past ... and hindsight is 20/20. 
Here are a few more (using the same magic formulas as above):


Here are some pivot point formulas (where particular values are chosen for the parameters α, β, γ and δ
Although none use the Open, the calculation of the Pivot Point might use it. For example:
|  Figure 3 |
If the formulas seem strange, we can rewrite them so they give deviations from previous levels, as a percentage of the PP, like so
(using the notation in Figure 3).
| R1 = PP (1 + b%) | S1 = PP (1 - a%) |
| R2 = R1 (1 + a%) | S2 = S1 (1 - b%) |
| R3 = R2 (1 + b%) | S3 = S2 (1 - a%) |
In place of a = H - PP, we consider a% = a/PP ... as a percentage of PP. And instead of b = PP - L, we use b% = b/PP etc..
Then it's easy to see how we can generate a jillion levels.
Of course, in addition to using today's prices, you might use yesterday's as well and maybe volume weighting or ..
>What's the best?
I have no idea. As you might expect, there are variations on variations. See, for example,
Investopedia.
>I assume these pivot points guys work pretty well, eh?
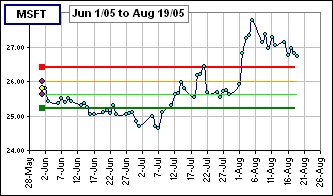
I have no idea, but here's an example where, each time the closing price crosses a resistance or support level, we calculate new ones.
>New ones? Which ones, since there are variations on variations and ...?
I use the magic formulas given above for R3 and S3 and PP = (H+L+C)/3.

>Uh ... could I have made any money there?
I have no idea.
>When do you think you might have an idea?
I have no idea ... but basing support and resistance upon a single day's price variations seems a mite simple-minded

